
From financial data to clear decisions.
See how we identify the real problem, break it into measurable drivers and build a basis for action. These examples cover profitability, budgeting and forecasting, plus an operational business case.
Growth without matching profit.
The fictional business has generated DKK 500,000 more revenue than budgeted, yet EBITDA is DKK 625,000 below budget. Management needs the reason before changing prices, purchasing or staffing.
Profit is not keeping pace with revenue.
Purchasing, project labour and fixed costs have risen faster than sales.
Examine the sales mix and project economics; test which actions could restore contribution margin.
What explains the gap?
A forecast built from drivers.
A DKK 14m revenue budget does not by itself show what the company can achieve. We start with the customer base and make assumptions about retention, upsell, new sales, margin and costs visible.
Management lacks a credible forward view.
Prioritise retention and contribution margin; test sensitivity before fixing budgets and capacity.
Budget EBITDA: DKK 14.00m × 38% − DKK 4.25m = DKK 1,070,000.
Improvement has to survive the calculation.
A fictional process takes 20 minutes per case. A new workflow may reduce active handling to 8 minutes. We separate time saved, licensing costs and investment before assessing the value.
Capacity is tied up in repetitive work.
Pilot the process, measure actual time and determine whether released capacity creates value.
Savings remain an assumption until case volumes, handling time, quality and the use of released capacity are verified.
See the complete analysis.
The interactive demonstration combines six views: financial overview, budget and forecast, profitability, business case, strategy and operations. Change assumptions to see how the result moves.
The standalone HTML demo uses a Power BI-inspired layout. Its interface is in Danish. All data and scenarios are fictional.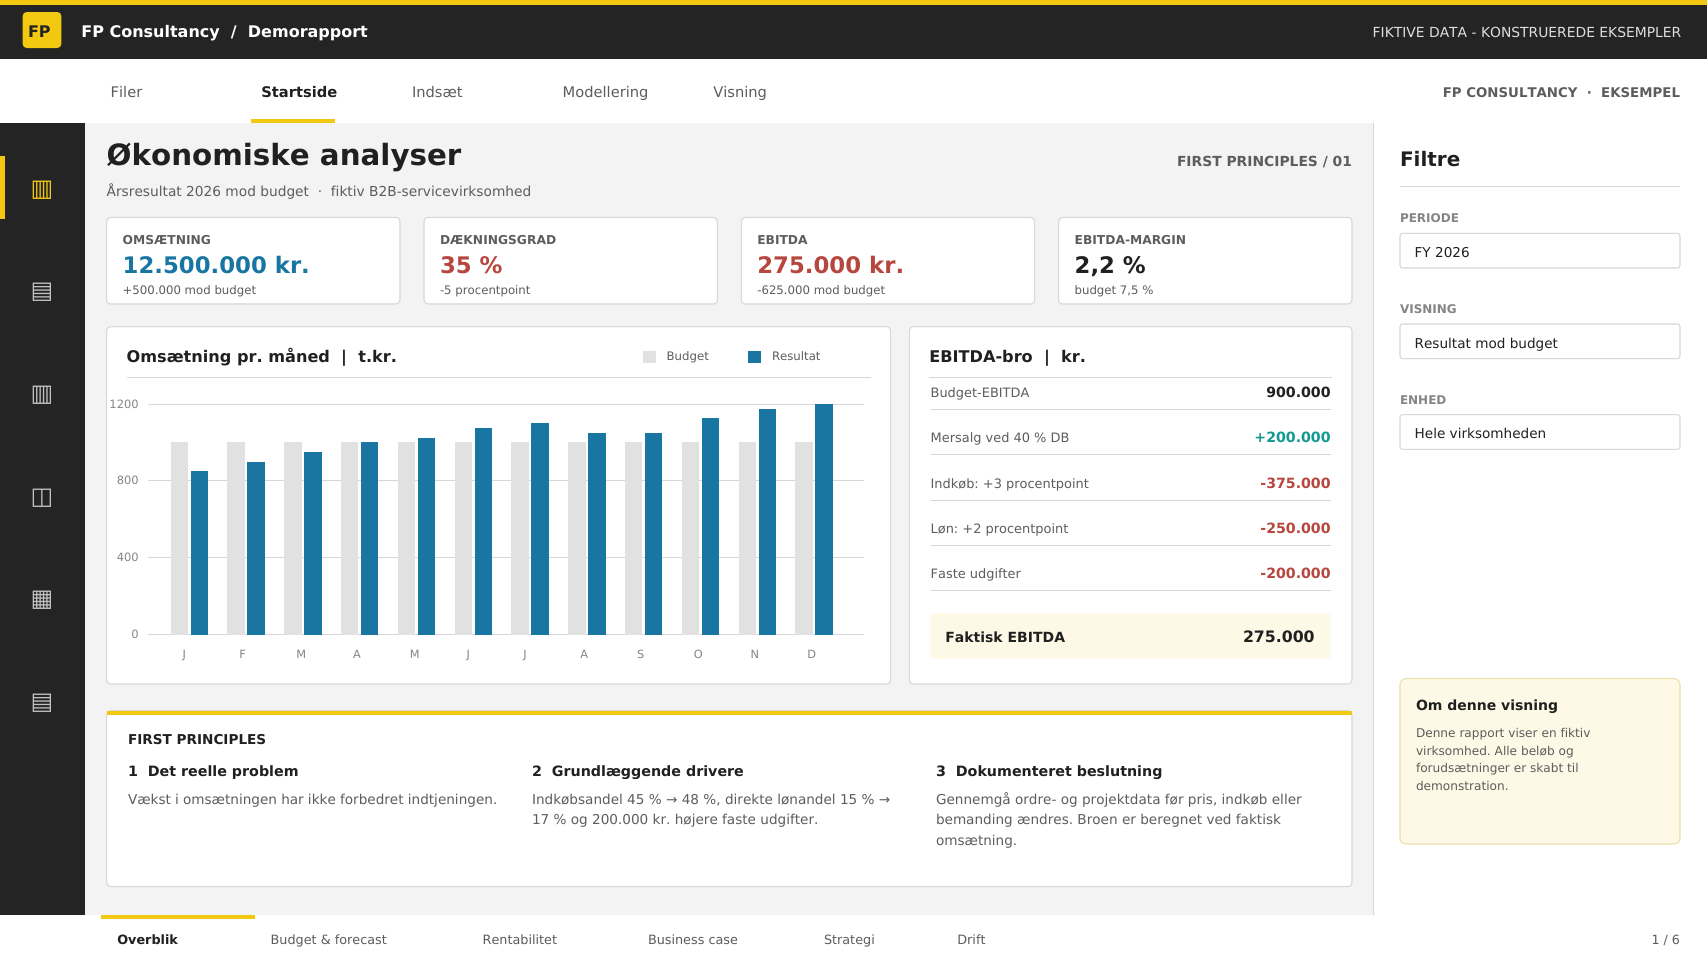 Explore the report ↗